Kip Tom
August 13, 2025
Driving Rural Prosperity by Reducing the U.S. Agricultural Trade Deficit
Overview
Agriculture and subsistence farming were among the primary professions at the time of our nation’s founding; professions which helped our fledging nation move westward. While today’s rural America - of which boasts 46 million people and 15% of our population— and its employment footprint looks much different, agriculture remains a top six rural employer alongside manufacturing, retail, health, hospitality, and government.
Unfortunately, the state of the U.S. farm and agricultural economy has waned in recent years, despite significant advancements in crop yields and other key performance metrics (such as gallons of milk per dairy cow and eggs per layer). Input costs have skyrocketed, commodity prices have declined, margins have tightened, and it has become overall more expensive and difficult to farm. Further, in addition to farmers and ranchers facing numerous natural disasters in recent years, farm income fell significantly between 2023 and 2024, marking the largest dollar value loss for agriculture in U.S. history.
Perhaps most alarmingly, agriculture is no longer a trade surplus industry in the U.S. This policy brief explores the current state of the U.S. agricultural trade deficit and suggests real policy solutions to reverse its negative trajectory, including through: 1) tariff and reciprocal tariff policies, 2) expanding new market access opportunities abroad with strategic partners, 3) robust follow-through and enforcement of trade deals and practices, 4) monitoring unfair trade practices globally, and 5) expanding domestic consumption of U.S. agricultural products.
The U.S. Farm Economy and Agricultural Trade Deficit
Over the past four years, farm input costs rose by 30% and the number of U.S. farms and ranches fell to 1.9 million—a 7% loss—in the latest USDA Census of Agriculture. Between 2022 and 2024, commodity prices fell from 30-year highs by double digits and by as much as 40% for some commodities, like rice. Further, net farm income fell significantly between 2023-2024 by more than $90 billion.
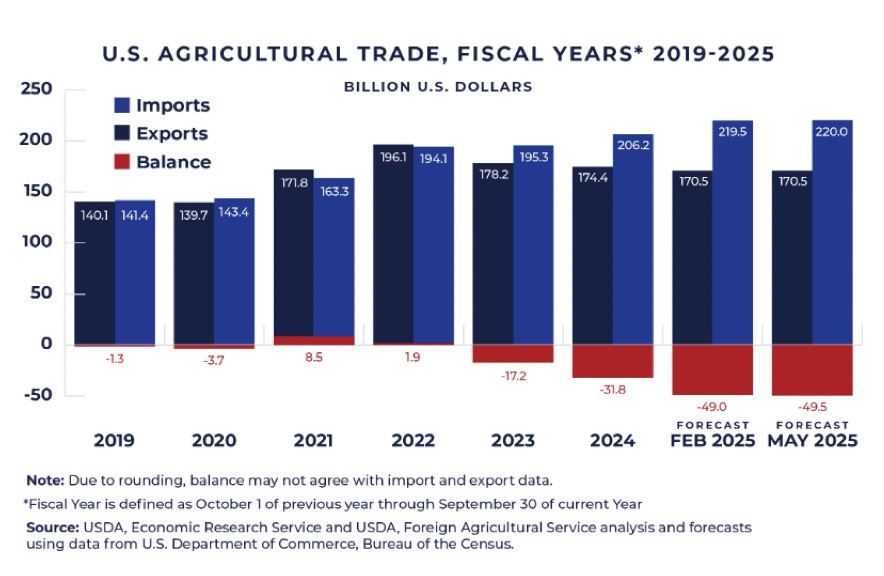
Contributing to the broken U.S. farm economy is the growing agricultural trade deficit, which occurs when the value of agricultural exports is less than the value of agricultural imports. The U.S. Department of Agriculture (USDA) currently projects an unprecedented $50 billion U.S. agricultural trade deficit for 2025, not considering any forthcoming impacts of the current administration’s tariff and reciprocal tariff strategy. This comes after a record $32 billion agricultural trade deficit in 2024.
The agricultural trade deficit is chief among U.S. farmers and ranchers’ primary concerns, as it is indicative of missed opportunities to sell their products at home and abroad. To keep market prices viable and profitable for farmers, their goods must have somewhere to go. Unfortunately, the agricultural trade deficit signals a serious lack of market access for farmers, underscoring the need for reduced foreign barriers to U.S. trade and additional trade deals. Rising trade deficits also signal increased U.S. dependence on foreign inputs and goods. Therefore, agricultural trade deficits warrant the serious attention of policymakers, so that our nation’s food supply remains incentivized and secure.
Agricultural trade deficits are relatively new. Until recently, the U.S. agricultural sector enjoyed a consistent agricultural trade surplus annually. In 2011, for example, the U.S. experienced a record $40 billion agricultural trade surplus. The sudden pivot to drastic, consistent trade deficits over the past four years has forced U.S. farmers and ranchers to adjust rapidly or be left behind, forcing them to accept ever-diminishing returns.
Outlook for U.S. Agricultural Trade: May 2025
A Snapshot of Key U.S. Agricultural Imports
From 1999 and 2024, U.S. agricultural imports increased from $40 billion to $213 billion. This has been the result of growing U.S. demand for consumer-oriented products (as opposed to bulk or raw commodity products), with almost 98% of the value of our agricultural imports now falling into this category.
Consumer-oriented agricultural products are high‑value products that are usually ready, or easily made ready, for immediate consumption. They include fruits and vegetables, nuts, alcoholic beverages, dairy products, meats, breakfast cereals, snack foods, and other processed foods—many of which have been subject to price inflation in recent years. In 2024, horticultural consumer-oriented agricultural products alone accounted for half of U.S. imports by value.
The ever-increasing trade deficit is not without unstable and illogical trading patterns. Why, for example, does the U.S. import 85% of its seafood when it is surrounded by 4,000,000 square miles of domestic fishing ground? Further, why does the U.S. import more than half of our fruit and 35 % of our vegetables, despite having a vast agricultural landscape? Such patterns must be explored and ultimately reversed, as they betray our hardworking farmers, ranchers, and fishermen.
A Snapshot of Key U.S. Agricultural Exports
Ten commodities comprised 57% of U.S. agricultural export value in 2024: soybeans, corn, beef products, tree nuts, pork and pork products, dairy products, soybean meal, food preparations, wheat, and poultry meat products. Our agricultural trade export surpluses are concentrated in soybeans, corn, and wheat. Those three exports constituted 95% of U.S. agricultural trade surpluses in 2024. While their positive balances help offset trade deficits, export surpluses in such very few commodities are demonstrative of widespread trade barriers and lack of market access for a variety of U.S. agricultural products.
The following are the current top destination markets for these three export surplus commodities:
- U.S. corn is a major commodity export to Mexico, Japan, and Columbia.
- U.S. soybeans are among the largest U.S. exports by value, and top markets are Mexico, the European Union (EU), and (until recently) China.
- U.S. wheat is largely exported to the Philippines, Mexico, and Japan.
In terms of global competition with respect to these three export surplus commodities, two decades ago, the U.S. was the world’s largest exporter of corn, wheat, and soybeans, with market shares of 68%, 24%, and 40%, respectively. By 2024, those market shares fell to 30%, 9%, and 26%, respectively.
Other countries have been quick to fill these gaps. Brazil, for example, in recent years has accelerated its transformation from an exporter of mainly tropical agricultural products to a major global agricultural powerhouse, producing many of the row crops already in abundance in the U.S. In 2023, Brazil became the world’s largest corn exporter. Other corn exporters, such as Argentina and Ukraine, have also chipped away at what was the U.S.’ share. Russia and the EU are the current top exporters of wheat, while Brazil leads in soybeans—both previously dominated by U.S. exports.
Contributing Factors to the U.S. Agricultural Trade Deficit
The potential and productivity of U.S. agriculture remains unmatched. However, as U.S. farmers and ranchers desperately search for greater opportunities to sell their products, other countries are simultaneously erecting barriers to U.S. agricultural trade exports.
There are two primary trade policy barriers inhibiting U.S. agricultural exports: tariff and non-tariff barriers.
Tariff Barriers: A tariff is a tax or duty imposed by a government on imported goods. They vary in specific type and calculation. Tariff rate quotas (TRQs) are related tools that allow for a minimum quantity of a product to be imported at a lower tariff rate, but once that quota is met, higher tariffs may apply. Aggressive TRQ structures can be used to price imports out of the domestic market.
Examples of Tariff and Tariff Rate Quota Barriers
- Thailand places a 50% tariff on U.S. beef, while allowing Australian and New Zealand beef to come in tariff-free.
- Brazil subjects U.S. ethanol to an 18% tariff, while the U.S. tariff on Brazilian ethanol has been just 2.5%. As a result, the U.S. in 2024 imported more than $200 million in ethanol from Brazil, while the U.S. exported only $52 million in ethanol to Brazil.
- China, from 2018-2019, placed a 25% tariff on U.S. soybean exports while the U.S. maintained zero tariffs on Chinese soybean imports.
- The U.S. has consistently faced relatively higher tariff barriers for agricultural exports to the EU compared to other goods, even before higher reciprocal tariffs of 2025. In 2015, the simple average tariff for agricultural goods imposed by the U.S. on EU exports was 4.7%, but U.S. exports to the EU was 13.7%. These tariff rate percentages remained similar in 2024 data.
- The EU also places especially strict tariff-rate quota volume limits on certain U.S. products, including beef, poultry, dairy, cereal, nuts, and sugar.
Non-Tariff Barriers: Non-tariff barriers to trade (NTBs) are trade restrictions that do not involve import taxes and are comparable to regulatory hurdles or bureaucratic red tape. They come in various forms, such as sanitary and phytosanitary (SPS) restrictions (e.g., aggressive quarantine requirements and unscientific restrictions on agricultural biotechnologies), unjustified technical barriers to trade (TBT) (e.g., restrictive packaging standards and labeling requirements), and behind-the-border barriers (e.g., permit and licensing barriers). All of these can intentionally impose unnecessary costs and market compatibility issues for U.S. agricultural products, thereby limiting their competitiveness.
Examples of Non-Tariff Barriers
- China’s biotech approval delays: Despite international scientific consensus regarding their safety, China maintains regulatory delays on genetically modified (GM) corn and soybeans from entering the country. This is a protectionist NTB that advantages Chinese farmers and biotechnology companies.
- The EU’s Farm to Fork (F2F) strategy: Through the F2F Strategy, introduced in May of 2020, the EU adopted multiple sustainability and other standards that could unnecessarily restrict trade.
- Egypt’s halal import certification requirements: In August 2021, Egypt announced that it would extend the scope of its halal certification requirements to include dairy and other agricultural products, in addition to the existing requirement for imports of poultry and meat products. It also announced that IS EG Halal, a private U.S. company, would be the sole certifying body approved to certify halal exports to Egypt effective January 1, 2026. The lack of transparency and the uncertainty created by these new requirements has contributed to a drop in U.S. dairy exports to Egypt.
- India's longstanding restrictions on GM crops: India has historically restricted the import and production of GM crops, including U.S. corn and soybeans.
- India’s undue health certification requirements: India also mandates a strict veterinary health certification for milk and milk product imports, confirming that they do not contain a host of drugs, antibiotics, pesticides, and/or other residues. The U.S. has raised concerns with the WTO that these are unwarranted trade barriers.
- India’s other aggressive requirements: India’s multi-layered quarantine system, including for U.S. fruits and vegetables, is among the strictest globally, especially when compared to other countries with more streamlined processes.
- Swiss agriculture is highly protected: According to the International Trade Administration, roughly all agricultural imports, especially those competing with Swiss products, are subject to seasonal import duties, tariff rate quotas, and import licensing. U.S. agricultural producers also face the dynamics of two retail giants (accounting for 70% of Swiss grocery sales) promoting their own regional products and store brands over international brands. The country also has a strict regulatory approval and labeling process for agricultural biotechnology products.
- Thailand’s food labeling requirements: Thailand requires that imported food products have Thai-language labels in place before entering the country, and certain labels must be pre-approved by the Thai Food and Drug Administration. These bureaucratic processes impede U.S. exports to Thailand, as they can be costly and slow for U.S. exporters.
Recent Policies
Decreased exports and reduced commodity values are largely the result of inadequate global market access and weak or unenforced trade agreements.
While U.S. trade policy formerly focused on supply chains and remained less active on formal trade agreements, President Trump’s first term was marked by numerous agreements that reduced barriers to trade and opened new export markets for U.S. agriculture. Among the most notable were the 2018 United States-Canada-Mexico Agreement (USMCA) and the 2020 Phase One Trade Deal with China.
U.S. farmers and ranchers have reason to be optimistic for the future too. President Trump and the Office of the U.S. Trade Representative (USTR) announced on May 8, 2025, an agreement with the United Kingdom that included over $700 million in ethanol exports and $250 million in other agricultural products, including beef. Further, on July 1, 2025, USDA announced greater access for U.S. frozen, fresh, and chilled poultry to Namibia.
On July 28, 2025, the White House and USTR announced that the U.S. and the EU reached a framework for a Cooperation Agreement on Reciprocal, Fair and Balanced Trade. Further development is underway, but its contents should include the elimination of NTBs including streamlining requirements for sanitary certificates for U.S. pork and dairy products, as well as the EU purchasing $750 million in U.S. energy.
On July 25, 2025, USTR and USDA announced a deal with Australia for expanded market access for U.S. fresh and frozen beef. For two decades prior, following a U.S. bovine spongiform encephalopathy (BSE or mad cow disease) outbreak in 2003, Australia largely restricted U.S. access. These restrictions on the U.S. were unique to Australia and remained long after world beef had normalized following the BSE outbreak. Australia in this announcement finally accepted U.S. biosecurity control measures to mitigate prior biosecurity concerns.
Historic deals with Indonesia and Japan were also recently unveiled. Notably, Japan will allow U.S.-grown rice greater market access, and Indonesia will eliminate tariff barriers, on a preferential basis, on agricultural and seafood products. The U.S.-Indonesia deal also contains several reduced NTB wins for U.S. agriculture, including through exempting U.S. food and agriculture products from onerous import licensing regimes, ensuring more fair geographical indicator requirements, providing permanent Fresh Food of Plant Origin designations that were desired by the U.S., and by providing greater recognition of U.S. regulatory oversight and accepting certificates issued by U.S. regulatory authorities.
Farmers First Trade Policy Recommendations
The following Farmers First policies are recommended to correct the growing U.S. agricultural trade deficit and bring lasting prosperity to rural America:
- Continue to Leverage Tariff and Reciprocal Tariff Trade Policies
U.S. farmers and ranchers must no longer be on the receiving end of unfair trade policies. To remedy this situation for U.S. agriculture and other sectors, the administration imposed a blanket 10% tariff on all countries in April of 2025. It also imposed a higher individualized reciprocal tariff on countries with which the U.S. has the largest trade deficits. Given these policies yielded fast results in trade negotiations, the administration reaffirmed its commitment to this reciprocal tariff strategy on July 31, 2025. These policies should remain intact until foreign countries’ tariff and non-tariff barriers are reduced, and the agricultural trade deficit is minimized. This will reset global trade policy for U.S. agriculture.
- Expand New Market Opportunities for U.S. Farmers and Ranchers
International markets enable U.S. farmers and ranchers to obtain the highest value for their products, especially those undervalued in the U.S. The USTR, USDA, and the U.S. Department of Commerce should prioritize looking into new market opportunities for U.S. agricultural exports. Potential markets may include EU, India, Kenya, and Southeast Asian countries.
- EU: Despite the uptick in tariff and non-tariff barriers to trade and some policy misalignment, the EU continues to serve as an attractive market for the U.S. Its 27 countries represent 17% of the world’s gross domestic product (GDP), and its 450 million consumers have strong purchasing power, many of whom are willing to pay premium prices for consumer-oriented, high-value agricultural products. Finally, the EU already has (or is actively negotiating) trade agreements with other countries, giving those producers preferred terms and advantages over U.S. producers. The new framework announced on July 28, 2025, is a welcome first step to increasing agricultural trade with the EU. Negotiations under this framework will be key, especially when promoting ethanol as a viable purchase with respect to the EU’s commitment of purchasing $750 million in American energy.
- India: As the largest country in the world with a population of 1.5 billion and a growing middle class, India represents opportunities to sell large volumes of U.S. agricultural products. India is open to negotiations with the U.S., but hurdles thus far have been over non-tariff barriers to trade on U.S. dairy exports, including animal diet certifications.
- Kenya: Embracing trade liberalization, Kenya already has an economic partnership agreement with the EU and is geographically ideal with its Port of Mombasa serving as a regional trade hub. Kenya’s youthful population and growing middle class also present rising opportunities for U.S. exports.
- Southeast/South Asia: With nearly 700 million people and a GDP of $3.6 trillion, Southeast Asia is one of the fastest-growing trade markets in the world. Already the third largest regional destination for U.S. agricultural exports, countries of focus include: Brunei, Cambodia, Indonesia, Laos, Malaysia, Myanmar, the Philippines, Singapore, Thailand, Timor-Leste, and Vietnam. With an unsuitable climate for temperate crops, Southeast Asia depends on foreign suppliers to meet agricultural demands. This presents opportunities for various U.S. agricultural products, including cotton, distiller’s grains, skim milk powder, soybeans and their derivatives, and wheat. In South Asia,Bangladesh and its fertile land and ample water resources has the potential to become a major agricultural powerhouse and U.S. trading partner due to its location at the crux of Southeast Asia. Further, like other countries listed above, it has a sizable population (175 million) and a growing middle class.
Further, policymakers must exhaust related federal programming complimentary of trade negotiations. For instance, USDA should ensure robust and timely implementation of its new agricultural trade promotion program, funded at $285 million annually starting in fiscal year 2026. This funding was included in H.R.1, the One Big Beautiful Bill (OBBB) to help expand international markets for U.S. agriculture and reverse the growing agricultural trade deficit.
- Pursue Follow-Through of Trade Agreements and Enforcement
Trade deals and agreements are only effective if they are adequately implemented and enforced. Unfortunately, over time, some trading partners—notably China—have failed to honor their commitments. For instance, the previous administration did not enforce key provisions of the Phase One Trade Deal with China, resulting in a shortfall of approximately $13 to $16 billion in expected agricultural purchases. Timely execution and rigorous follow-up are critical for preventing non-compliance or “backsliding” in agreements, and for maintaining the integrity of agreements. USTR, USDA, and the Department of Commerce must continue bilateral engagement, even after trade agreements are signed.
Further, the U.S. government may also leverage enforcement tools available under the Trade Act of 1974, as appropriate, including its Section 301 investigations to enforce U.S. rights under trade agreements. Under Section 301, USTR may investigate and take retaliatory action (e.g., impose tariffs, suspend trade agreement concessions, and/or work out an agreement with a foreign government to address the issue) to enforce trade agreements and respond to unfair foreign trade practices.
An example of a Section 301 investigation: On July 15, 2025, USTR announced a Section 301 investigation into Brazil which will determine whether many of the country’s current trade practices, including their decision to pivot away from relatively duty-free U.S. ethanol exports, burden U.S. commerce, with the investigation potentially resulting in responsive action on the part of the U.S. Public comments are due this summer (2025), and a hearing on the investigation will follow. This is a prime example of a policy tool being utilized to investigate and address unfair trading practices and hold countries accountable to U.S. farmers and ranchers.
Additionally, the U.S. International Trade Commission (USITC) has legal authorities to pursue safeguard investigations under Section 201 of the 1974 Trade Act. Under this investigation process, domestic industries seriously injured or threatened by increased imports may petition the USITC for import relief. Once the USITC reviews the case, and if an affirmative determination is made, it makes a recommendation to the President on how to proceed and provide relief, who then makes the final decision on how to proceed. The USITC should carefully review current petitions, especially those identifying imports that could possibly be undermining our domestic food supply.
An example of a Section 201 investigation and action: In 2018, President Trump approved safeguard tariffs on imported residential washing machines and solar cells and modules, based on investigations, findings, and recommendations conducted by the USITC. New tariff rate quota terms were applied on foreign imports of these products, which had been harming domestic manufacturing. Such investigations, and any resulting necessary outcomes, could be applied to agricultural product imports, which could ultimately yield greater domestic consumption.
- Monitor Unfair Trade Practices by Competitors
The USITC—working in close coordination with the Office of the U.S. Trade Representative’s Chief Agricultural Negotiator and the USDA’s Trade and Foreign Agricultural Affairs division—should enhance efforts to routinely monitor, investigate, and address (if necessary) illegal market-distorting subsidies used by global competitors to artificially lower prices, skew competition, and create foreign advantages. Increasing transparency and scrutiny around unfair trade practices can impact other countries’ behaviors towards the U.S., including towards U.S. agricultural producers.
Under the Tariff Act of 1930, the USITC can launch Sec. 332 fact-finding investigations. Such findings of these investigations, when made public, can help curb foreign behaviors that that negatively impact U.S. trade, and can also impact policymakers’ future decisions.
An example of a Sec. 332 investigation and report: House Committee on Ways and Means Chairman Jason Smith (R-Missouri-8) in 2024 requested (and received in 2025) a new USITC Sec. 332 investigation and report examining the global competitiveness of U.S. rice producers. The USITC’s 2025 report asserted domestic rice is at a disadvantage globally due to a host of unfair trade practices, including foreign subsidies, that artificially lower cost of production abroad and decrease U.S. market share. Reports enhancing transparency like these can help curb foreign behaviors negatively impacting U.S. trade and better inform policymakers’ future policy decisions.
- Expand Domestic Consumption of U.S. Agricultural Products
White House policy councils, USTR, USDA, the Department of Commerce, and the Small Business Administration should form an interagency working group to inventory current missed opportunities to sell U.S. agricultural commodities domestically.
Working alongside state and local governments on the frontlines, the interagency working group should collect data and informational interviews from/with U.S. food and agricultural manufacturers to better understand why they are not purchasing more U.S. agricultural products, and what policy changes would promote more purchases into domestic supply chains. Such policy solutions could include more timely approvals for modernized technology applications in agriculture, greater America first marketing incentives, and an overall more favorable regulatory climate.
The working group should coordinate with other ongoing federal efforts to retain and expand manufacturing in the U.S.—particularly in rural America. For purposes of incentivizing and expanding such manufacturing, tax provisions in the OBBB, such as rural qualified opportunity funds, may be utilized to attract job creators and investors.
Further, the interagency working group might explore how continued reciprocal tariffs on imports helps incentivize and expand domestic purchasing and manufacturing of U.S. agricultural products.
Conclusion
U.S. policymakers have a unique opportunity to reverse the agricultural trade deficit. They must continue leveraging tariff and reciprocal tariff trade policies to reduce barriers to trade and expand market access in countries strategically beneficial to U.S. farmers and ranchers. Further, U.S. policymakers have many tools at their disposal to enforce trade commitments and monitor unfair practices globally. Finally, federal, state, and local policymakers should partner together to identify what policies and/or policy changes are necessary to enhance greater domestic purchasing and manufacturing of U.S. agricultural products.
Policymakers are implored to take an “all of the above” approach with respect to the above policies. Doing so will enable farmers and ranchers to realize greater opportunities to sell their crops at home and abroad, all while reversing the current trajectory of the U.S. agricultural trade deficit. Ideally, reinstating times of trade surpluses would provide greater long-term farm profitability and market certainty for our signature agricultural sector, thereby driving greater prosperity in rural America.