November 4, 2025
OFRA Estimate E2025–009
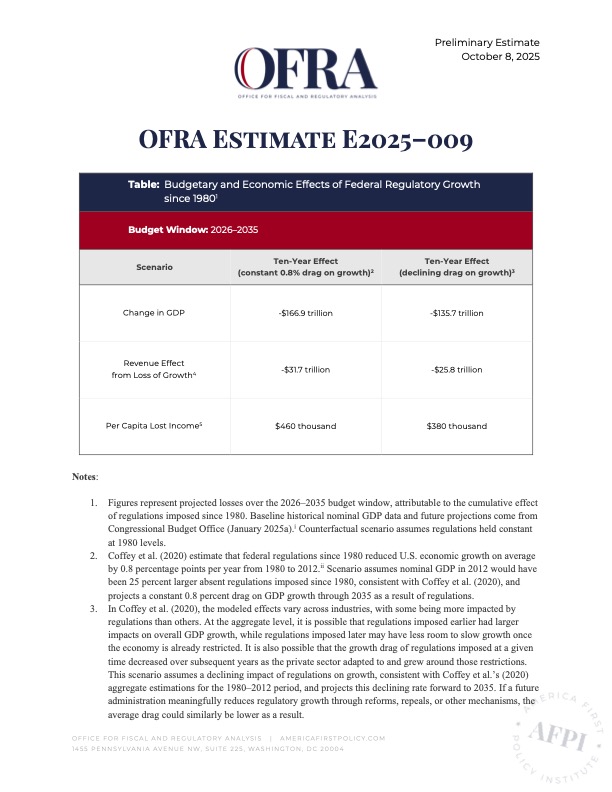
Table: Budgetary and Economic Effects of Federal Regulatory Growth
Since 1980 — Budget Window: 2026–2035
| Scenario | Ten-Year Effect (constant 0.8% drag on growth) |
Ten-Year Effect (declining drag on growth) |
|---|---|---|
| Change in GDP | –$166.9 trillion | –$135.7 trillion |
| Revenue Effect from Loss of Growth | –$31.7 trillion | –$25.8 trillion |
| Per Capita Lost Income | $460 thousand | $380 thousand |
Notes:
- Figures represent projected losses over the 2026–2035 budget window, attributable to the cumulative effect of regulations imposed since 1980. Baseline historical nominal GDP data and future projections come from the Congressional Budget Office (January 2025i). The counterfactual scenario assumes regulations held constant at 1980 levels.
- Coffey et al. (2020) estimate that federal regulations since 1980 reduced U.S. economic growth on average by 0.8 percentage points per year from 1980 to 2012. The scenario assumes nominal GDP in 2012 would have been 25 percent larger absent regulations imposed since 1980, consistent with Coffey et al. (2020), and projects a constant 0.8 percent drag on GDP growth through 2035 as a result of regulations.
- In Coffey et al. (2020), the modeled effects vary across industries, with some being more impacted by regulations than others. At the aggregate level, it is possible that regulations imposed earlier had larger impacts on overall GDP growth, while regulations imposed later may have less room to slow growth once the economy is already restricted. It is also possible that the growth drag of regulations imposed at a given time decreased over subsequent years as the private sector adapted to and grew around those restrictions. This scenario assumes a declining impact of regulations on growth, consistent with Coffey et al.’s (2020) aggregate estimations for the 1980–2012 period, and projects this declining rate forward to 2035. If a future administration meaningfully reduces regulatory growth through reforms, repeals, or other mechanisms, the average drag could similarly be lower as a result.
- Each $1 of lost output reduces federal receipts by $0.19iii.
- Based on projections of U.S. population, 2026–2035, from the Congressional Budget Office (2025iv).
i Congressional Budget Office, “Historical Data and Economic Projections” (January 2025).
ii Coffey, Bentley, Patrick A. McLaughlin, and Pietro Peretto, “The Cumulative Cost of Regulations” (2020).
iii Rule-of-thumb fiscal impact derived from Congressional Budget Office, “How Changes in Economic Conditions Might Affect the Federal Budget: 2025 to 2035” (March 2025), and Congressional Budget Office, “The Budget and Economic Outlook: 2025 to 2035” (January 2025a), Table B-1 in Appendix. See also OFRA Estimate E2025–003.
iv Congressional Budget Office, “The Demographic Outlook: 2025 to 2055” (January 2025b).