HOUSEHOLD SAVINGS FROM ENERGY DOMINANCE: ONE YEAR LATER
Key Takeaways
« By the one-year mark of President Trump’s term, the average nationwide gasoline price has fallen nearly 10%.
« “Blue state” policies such “Net Zero” mandates drive up the price of electricity, while rates stay steady in “red states” that value cost-effective, reliable energy.
« The Working Families Tax Cut helps consumer electricity prices by phasing out vast subsidies for unreliable electricity that caused significant rate hikes.
Overview
One year into the Energy Dominance agenda, the facts are already clear and unsurprising: abundance trumps scarcity, freedom beats mandates, and energy price spikes are cooling and even falling. When bureaucracy and red tape grow, the American people suffer at the meter and at the pump. But President Trump has taken strong actions to lower gasoline prices for American drivers, declaring a national energy emergency to speed up approvals for key infrastructure and energy projects. His actions have unleashed Alaska’s extraordinary oil and gas potential, ended the previous administration’s wrongful ban on oil and gas leasing, and restored and accelerated leasing, including in the Gulf of America.
How have national gasoline prices changed throughout recent administrations?
According to data from the U.S. Energy Information Agency, the week that President Trump took office in January 2017, the average price of gasoline nationwide was $2.326. The week he left office in January 2021, the average price of gasoline nationwide was $2.379—a change of just a few cents and lower than the overall rate of inflation. The week that President Biden left office in January 2025, the average price of gasoline nationwide was $3.109, up 31% from the end of President Trump’s term.
365 days after President Trump took office and renewed the energy dominance agenda, the average weekly price of gasoline nationwide is $2.806, already down roughly 9.8% from the end of President Biden’s term.[1] Notably, a 9.8% price decline reduces the cost of filling a 30-gallon gas tank by $9.09. According to GasBuddy’s 2026 Fuel Price Outlook, the annual average gasoline price for American families is projected to come down to $2,083 in 2026, from $2,715 in 2022. This price drop is the result of America First policies, such as declaring a national energy emergency to accelerate permitting and infrastructure approvals, reopening and expanding federal leasing, and signaling to the business and investment communities that expanding U.S. production is a national priority. Such measures reduce expected supply constraints and uncertainty, and can lower the “risk premium” that often shows up in gasoline prices paid by families.
What do January 2026 gasoline prices look like across the country?
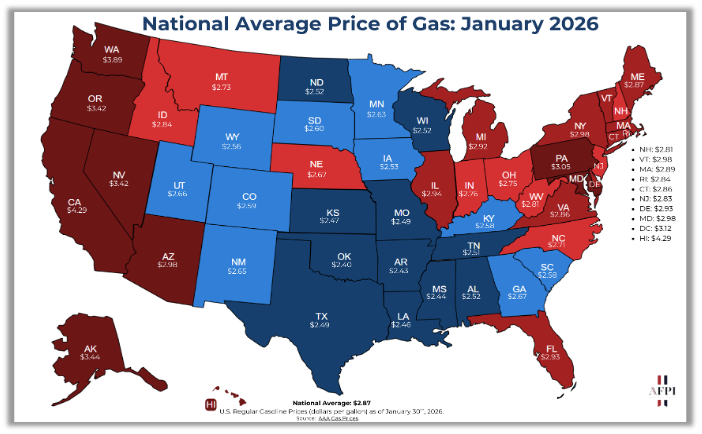
Figure 1
National Average Price of Gas: January 2026
Note: Figure 1 summarizes state-by-state retail gasoline prices in January 2026. The map reports a national average of $2.81 per gallon for regular grade gasoline.
How have residential electricity prices changed since 2016?
According to data from the U.S. Energy Information Agency, during 2016 (President Obama’s last full year in office), the average national residential electricity price was 12.55 cents per kilowatt-hour (¢/kWh). By 2020 (President Trump’s last full year in office), the average national residential electricity price had risen to 13.15 ¢/kWh. By 2024 (the last full year that President Biden was in office), the average residential electricity price nationwide had risen to 16.48 ¢/kWh. As of December 2025, the year-to-date average national residential electricity price was 18.07 ¢/kWh.
Why do electricity rates differ so much by state?
Although rising electricity prices are felt by consumers nationwide, the reality is more complex than the national average. This is because states that protect energy freedom (meaning policies that prioritize affordability and reliability by allowing a full range of energy resources, rather than steering the grid through technology mandates, emissions targets, or preferential subsidies) are more affordable, while states with harsh “green” mandates pay more, because state laws can have enormous impacts on electricity prices. States like California, Hawaii, and New York—which have disproportionately higher electricity prices—drive up the national average.
Figure 2
Average U.S. residential electricity price, ¢/kWh
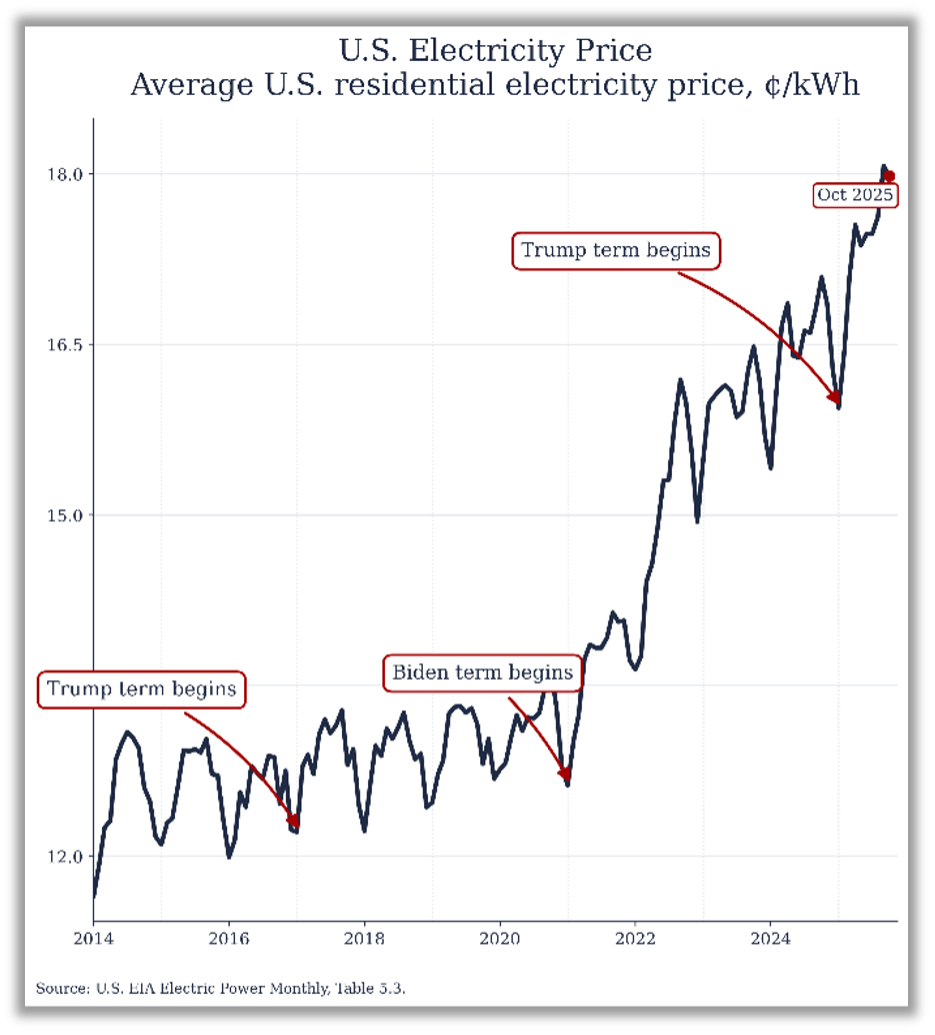
Note: Figure 2 summarizes the average U.S. residential electricity prices in ¢/kWh from January 2014 to October 2025. The map reports the increase in electricity prices over the last 11 years.
For example, the California Business Roundtable found that the state’s average residential electricity rate in 2022 was 26.17 cents per kilowatt-hour. By January 2026, that amount had increased by more than 20% to 31.58 ¢/kWh. In contrast, states like Kentucky and Tennessee rely on fossil fuels and nuclear to meet the majority of their electric demand, which has helped to keep their residential electricity prices below the national average. Conversely, California, Maine, New York, and other states have focused on “green” policies such as “Net-Zero” emissions mandates. These mandates have been criticized by President Trump as the “Green New Scam,” in part because they tend to cause rapid increases in energy prices. For example, when policymakers mandate preferred, intermittent technologies, consumers generally pay twice: first for the new generation, and again for the backup capacity and grid expansion required to maintain reliability.
The Institute for Energy Research (IER) reports that “86% of states with electricity prices above the national average in the continental U.S. are reliably blue…In contrast, 80% of the 10 states with the lowest electricity prices are reliably red.”[2] Moreover, IER finds that the five most costly states for electricity all require 100% carbon-free electricity, thereby driving up prices needlessly. They add, “More than almost any other product, electricity prices are a direct result of state energy policies because states have the exclusive power to decide which resources supply their grids.”
In other words, higher-priced states are more likely to require specific generation mixes through “net-zero” style mandates and technology-preference rules, which can force utilities to procure higher-cost power, overbuild intermittent resources, and then spend heavily on backup capacity and grid buildouts to keep the lights on. Lower-priced states more often allow utilities to meet demand with the most cost-effective mix available, especially dispatchable resources that can run when needed, thus reducing the need for duplicative capacity and costly, mandate-driven infrastructure spending.
What do residential electricity rates look like across the country?
Energy dominance is essential to ensuring electricity rates U.S. households remain economical. As figure 3 demonstrates, states that prioritize reliable American energy have kept electricity prices, on average, much lower than states that are limiting their production of reliable energy.
Figure 3
National Average Residential Electricity Rates: November 2025
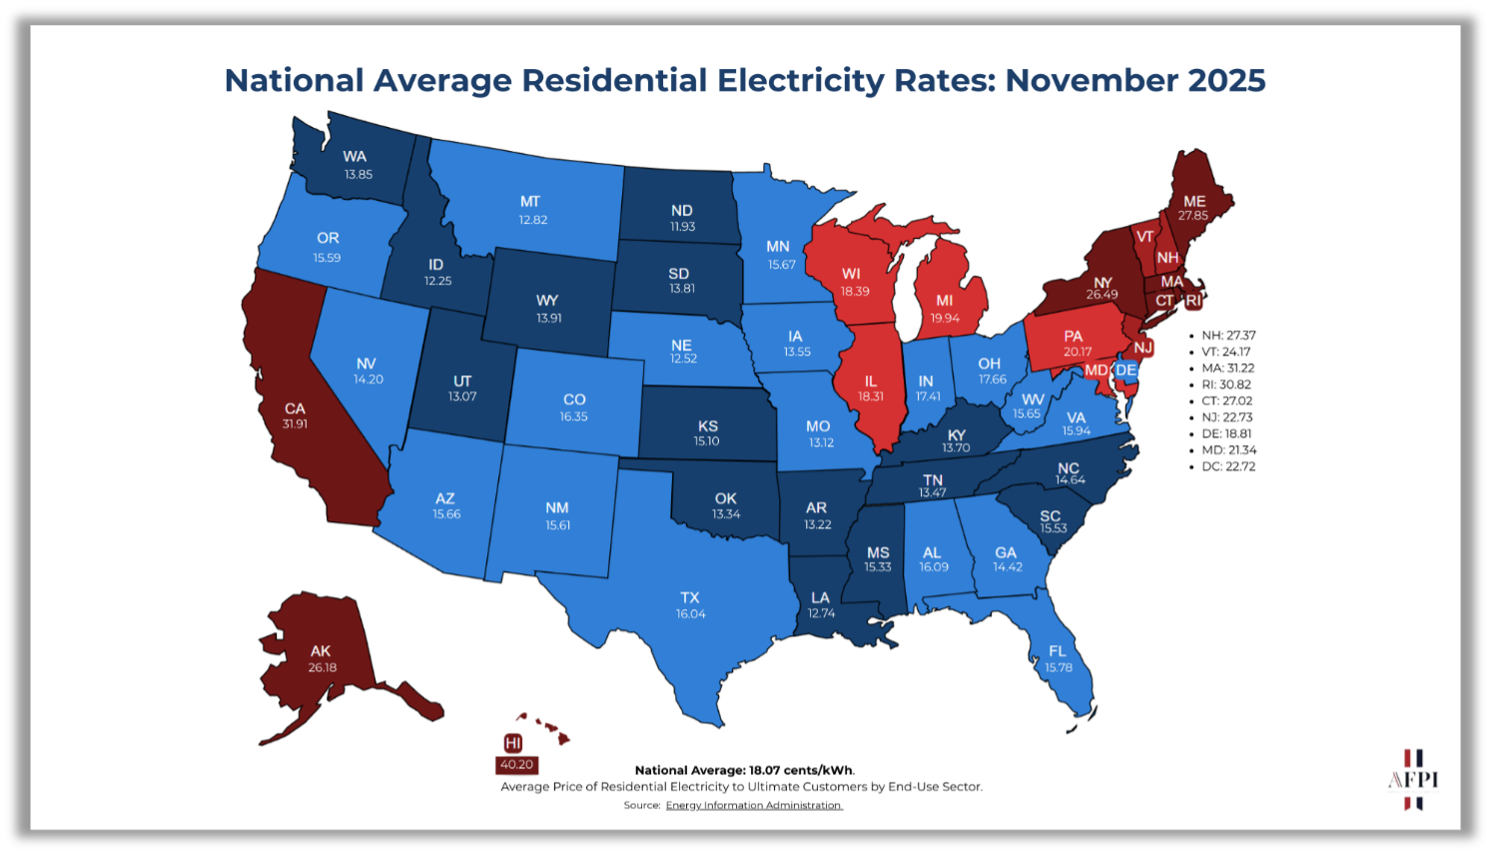
Note: Figure 3 summarizes state-by-state residential electricity prices in November 2025. The map reports a national average of 18 ¢/kWh for shows substantial variation across states.
How has the Working Families Tax Cut Act affected electricity prices?
President Trump’s Working Families Tax Cut Act took many important steps to increase American energy production and lower prices for Americans. But wind and solar advocates, progressive politicians, and climate activists have criticized the President’s tax cut for electricity prices that remain high following the massive price spike caused by the previous administration’s policies.
The Working Families Tax Cut Act Has Led to Lower Energy Prices in three specific ways. First, the tax cut phased out some wasteful spending on subsidy-dependent solar and wind. However, these phaseouts have not yet gone into effect, so it is nonsensical to blame them for higher prices. Depending on the subsidy, new wind and solar projects can still access these tax credits at least until July 4, 2026.
Second, electricity prices follow a multi-year lag because rate hikes follow longer cost trends. Analyses from S&P Global and energy analysts Isaac Orr and Mitch Rolling show that rate hikes are largely attributable to new infrastructure buildouts for intermittent “green” power.
Last, boosters of “green” energy have systematically misrepresented the true cost of intermittent energy to make it look cheap and build far more solar and wind than the market demands. As the Working Families Tax Cut was being considered, big-money green-industry lobbyists admitted that even the compromise phaseout of wind and solar subsidies would devastate their industry, thereby undercutting their original claim that wind and solar power are cost-effective.
Conclusion
Trump Administration policies have saved American families billions of dollars by cutting waste, fraud, and abuse and stopping funding for so-called renewable energy projects that do not serve the American people. To benefit from lower prices, blue states must abandon net-zero mandates that throttle American energy production, which leave American families trapped in a deliberately engineered “affordability” and supply crisis as a result. Instead, America must remain committed to building and maintaining reliable generation sources such as fossil fuel and nuclear power in order to provide dependable and affordable energy for all Americans.
[1] While it is true that in an international market, many factors affect gasoline prices and the President cannot act unilaterally to set those prices, it is naïve to claim that a President’s energy policy does not influence them.
[2] “Reliably red” or “reliably blue” are defined in the study as states that voted for either the Republican or Democratic nominee for president in both the 2020 and 2024 elections.