June 4, 2026
|
America First Policy Institute
OFRA Estimate
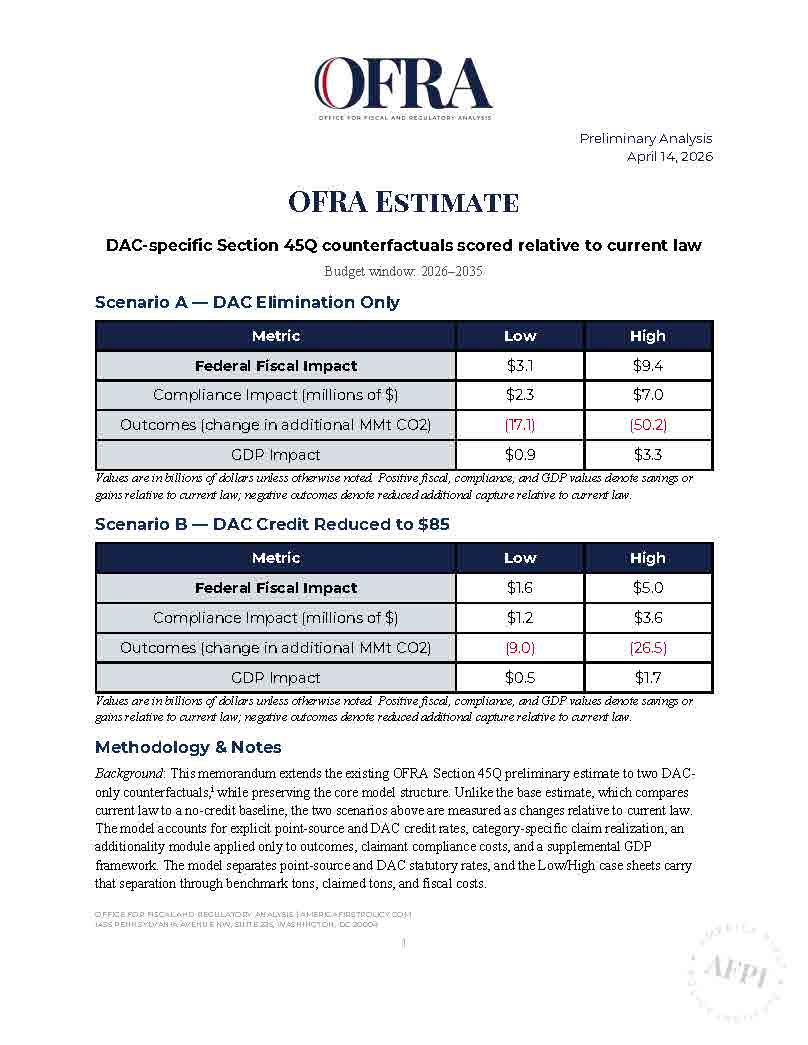
DAC-specific Section 45Q counterfactuals scored relative to current law
Budget window: 2026–2035
Scenario A — DAC Elimination Only
| Metric | Low | High |
| Federal Fiscal Impact | $3.1 | $9.4 |
| Compliance Impact (millions of $) | $2.3 | $7.0 |
| Outcomes (change in additional MMt CO2) | (17.1) | (50.2) |
| GDP Impact | $0.9 | $3.3 |
Scenario B — DAC Credit Reduced to $85
| Metric | Low | High |
| Federal Fiscal Impact | $1.6 | $5.0 |
| Compliance Impact (millions of $) | $1.2 | $3.6 |
| Outcomes (change in additional MMt CO2) | (9.0) | (26.5) |
| Impact | $0.5 | $1.7 |
Methodology & Notes
Background: This memorandum extends the existing OFRA Section 45Q preliminary estimate to two DAConly counterfactuals,i while preserving the core model structure. Unlike the base estimate, which compares current law to a no-credit baseline, the two scenarios above are measured as changes relative to current law.The model accounts for explicit point-source and DAC credit rates, category-specific claim realization, an additionality module applied only to outcomes, claimant compliance costs, and a supplemental GDP framework. The model separates point-source and DAC statutory rates, and the Low/High case sheets carry that separation through benchmark tons, claimed tons, and fiscal costs.
Fiscal Effects: Federal fiscal effects were scored on forecast current-law DAC claimed tons. Scenario A sets the DAC credit to $0. Scenario B sets the DAC rate equal to the point-source rate each year. All non-DAC rates, claim rates, and benchmark tons remain unchanged.
Outcomes: Outcome effects keep non-DAC additionality unchanged. Scenario A sets DAC additionality to zero. Scenario B scales DAC additionality by 85/180, the ratio of the modified DAC rate to the current-law DAC rate under the shared escalator. This preserves the original deployment benchmark and applies behavior only through the DAC-specific additionality channel.
Compliance Costs: Compliance effects use the same claimant-count logic as the original preliminary estimate. DAC claimant counts are estimated from DAC claimed tons divided by average claimed tons per claimant. Scenario A removes DAC claimants. Scenario B scales DAC claimant participation by the same 85/180 factor used for DAC additionality.
GDP: GDP effects use the same stylized formula as the original estimate. Deadweight loss on compliance costs plus marginal excess burden on fiscal costs, plus a carry-forward term.
Context and Sensitivity
Because point-source 45Q remains intact, the modified-policy still implies substantial residual activity and fiscal cost. Under Scenario A, residual federal fiscal cost over 2026–2035 is about $27.3 billion in the low case and $47.1 billion in the high case, with residual additional capture of 216.5 and 407.5 million metric tons, respectively. Under Scenario B, residual fiscal cost is about $28.8 billion and $51.5 billion, with residual additional capture of 224.6 and 431.3 million metric tons.
Results scale materially with the assumed DAC share because only the DAC component of the credit is changed. A rough ±25 percent change in the DAC share assumption would move Scenario A fiscal savings by about ±$0.8 billion in the low case and ±$2.4 billion in the high case; Scenario B fiscal savings would move by about ±$0.4 billion and ±$1.2 billion, respectively. Outcome losses would move proportionally.
Scenario B is also sensitive to the assumed DAC elasticity. Under a pure no-behavior view, the outcome loss in Scenario B would be near zero. Under a cliff-case view, the outcome loss would approach Scenario A ((17.1) low and (50.2) high). The mainline specification used here sits between those bounds at (9.0) low and (26.5) high.